Honey Quality Testing Method using HPLC-UV & SEDEX LT-ELSD
Honey is a complex mixture mainly produced by bees, from plant nectar, using regurgitation process and involving an enzymatic transformation of the nectar. In its most common form, honey is mostly composed of fructose, glucose, maltose and sucrose and also a lot of minor compounds (carbohydrates, organic acids…). Hydroxymethylfurfural (HMF) is one of those minor compounds but with a special attention: this compound was potentially considered carcinogenic to humans and is also a perfect indicator of honey quality since its quantity is directly related to heating process or bad storage conditions. HMF is induced by a Maillard reaction of carbohydrates with heat.
HMF is thus limited by Codex Alimentarius to 40ppm in honey (or 80ppm for tropical honeys). HMF quantitation, in the meantime to major carbohydrates profile is then of interest to assess the global quality of honey.
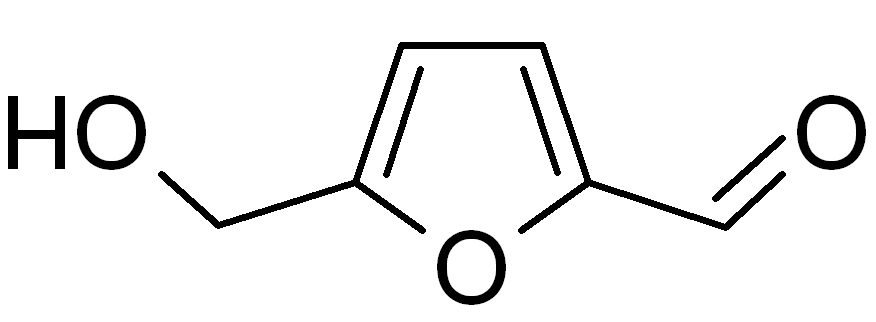
Hydroxymethylfurfural (HMF)
HMF is a furfural compound which is an excellent chromophore group and allows a good detection in UV. Carbohydrates don’t have chromophore group and must be detected by using another detection mode. Evaporative Light Scattering detector (ELSD) is the most efficient way: this detector is a universal detector that can detect every compound which is less volatile than the mobile phase. This detector is compatible with gradient elution, all mobile volatile phases (reverse or normal phase) and provides a better sensitivity than Refractive Index Detector.
Coupling ELSD to UV is easy, the output of UV can be directly connected to ELSD which is a destructive detector and must be the last detector of the system. So that using coupled detectors allows direct quantitation using the two channels in the meantime. In our application, HMF will be quantified using UV, while the carbohydrate profile will be determined using ELSD.
Coupling ELSD to UV is easy
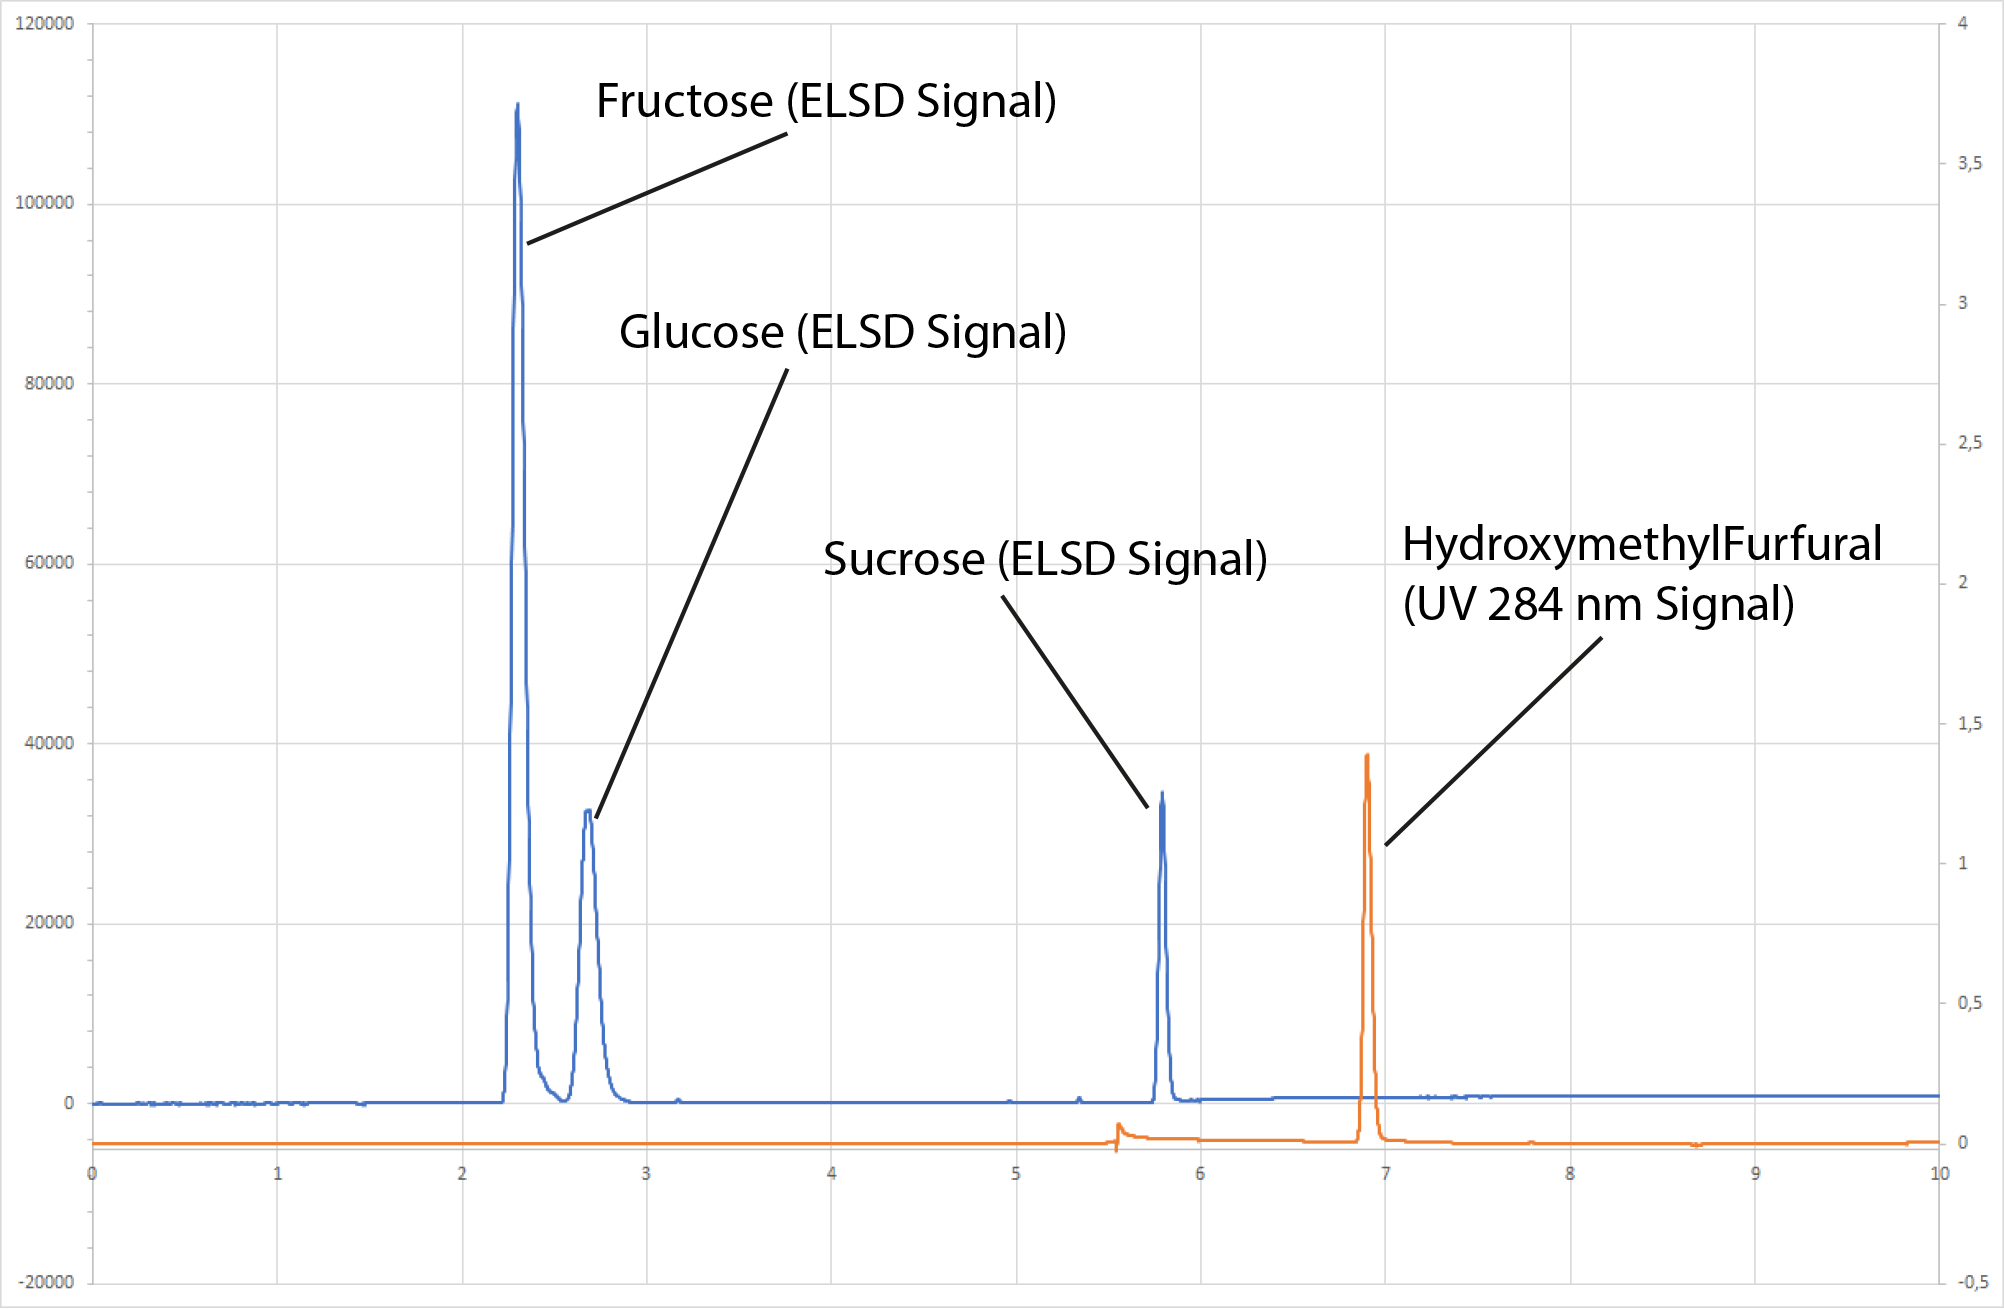
Double Detection Chromatograph of Honey Mix - Blue is ELSD data, Red is UV data
Chromatographic conditions & Results
For this analysis, we have to manage two structurally different compounds, carbohydrates are very polar compounds while HMF is an organic compound that exhibits an apolar moiety. Several conditions may be investigated, but a fast and convenient analysis has been developed using a Porous graphitic column that allows the separation of both polar and apolar compounds within a single reverse phase type gradient. We have selected an HPLC column with a low internal diameter in order to decrease the solvent consumption. The total analysis time (reconditioning time 7min) is 15 minutes, allowing a high throughput of analysis.
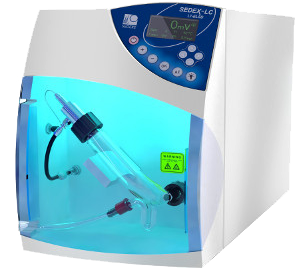
The ELSD used for this experiment is SEDEX LC, a universal detector capable of detecting all solutes which are less volatile than the mobile phase. This detector allows a very straightforward quantitation of carbohydrates thanks to 5 decades of dynamic range, accommodating easily with multiple concentration levels in the same sample.
The method optimized allows the detection of major carbohydrates and HMF within 8 minutes. Data acquisition of UV and ELSD detectors is realized simultaneously. In order to facilitate and speed up the whole analysis time, the calibration solutions are realized mixing both carbohydrates and HMF standards.
While selectivity of the method is verified during method optimization, quantitative aspects are validated through specific experiments. Sensitivity of the analysis for the carbohydrates is not of concern and has not been tested, we focused mainly on quantitation curves.
ELSD is considered as a non-linear detector, however, only the low concentrations domain is non-linear. For wide concentrations range, non-linear quantitation is easily realized using quadratic or polynomial fit regression available in all modern chromatographic software. In the case of honeys, the carbohydrate content is high, and response of those compounds is in the linear domain, for which a simple linear relationship is possible.
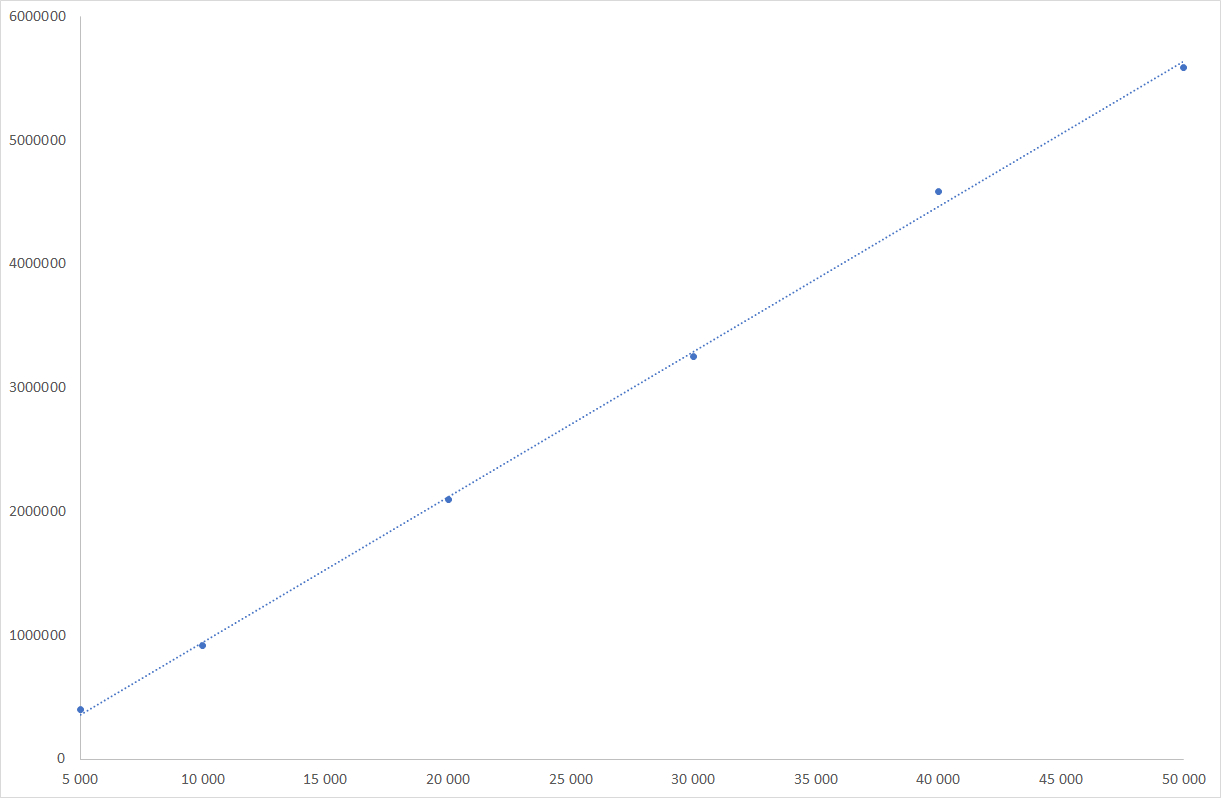
Fructose linearity graph
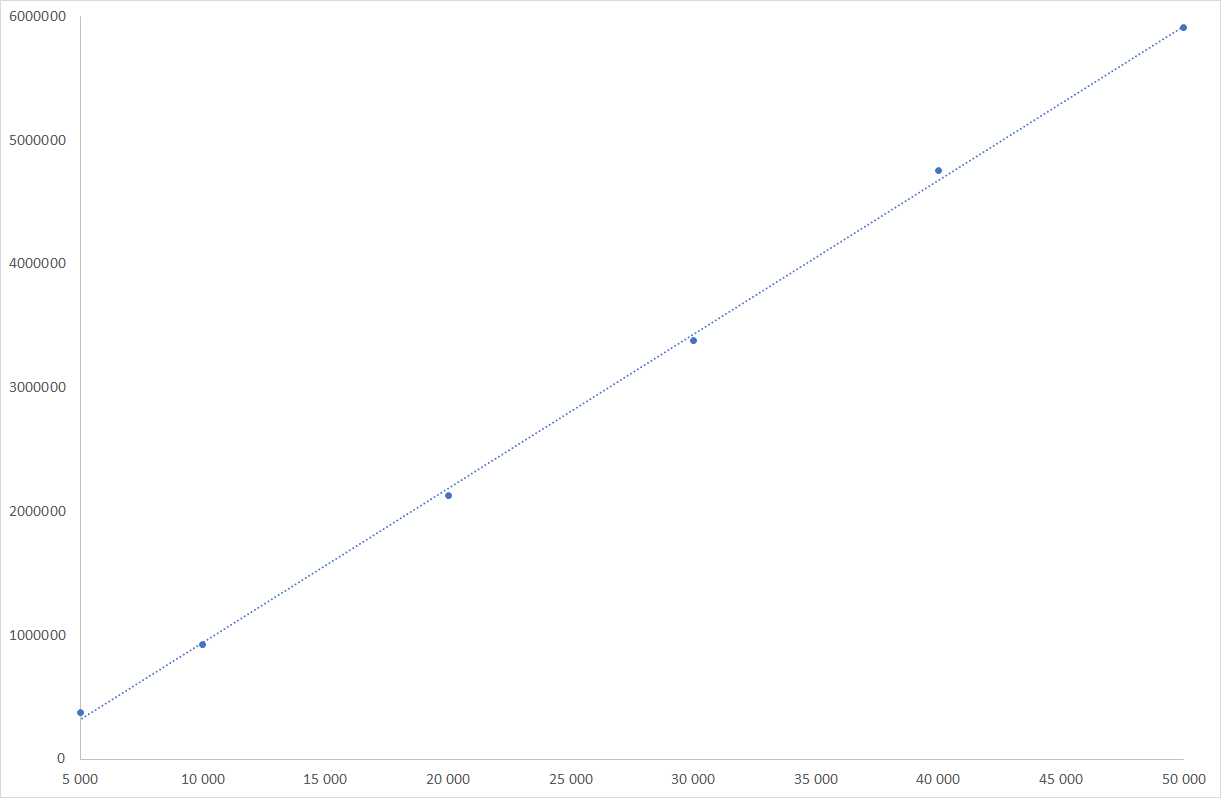
Glucose linearity graph
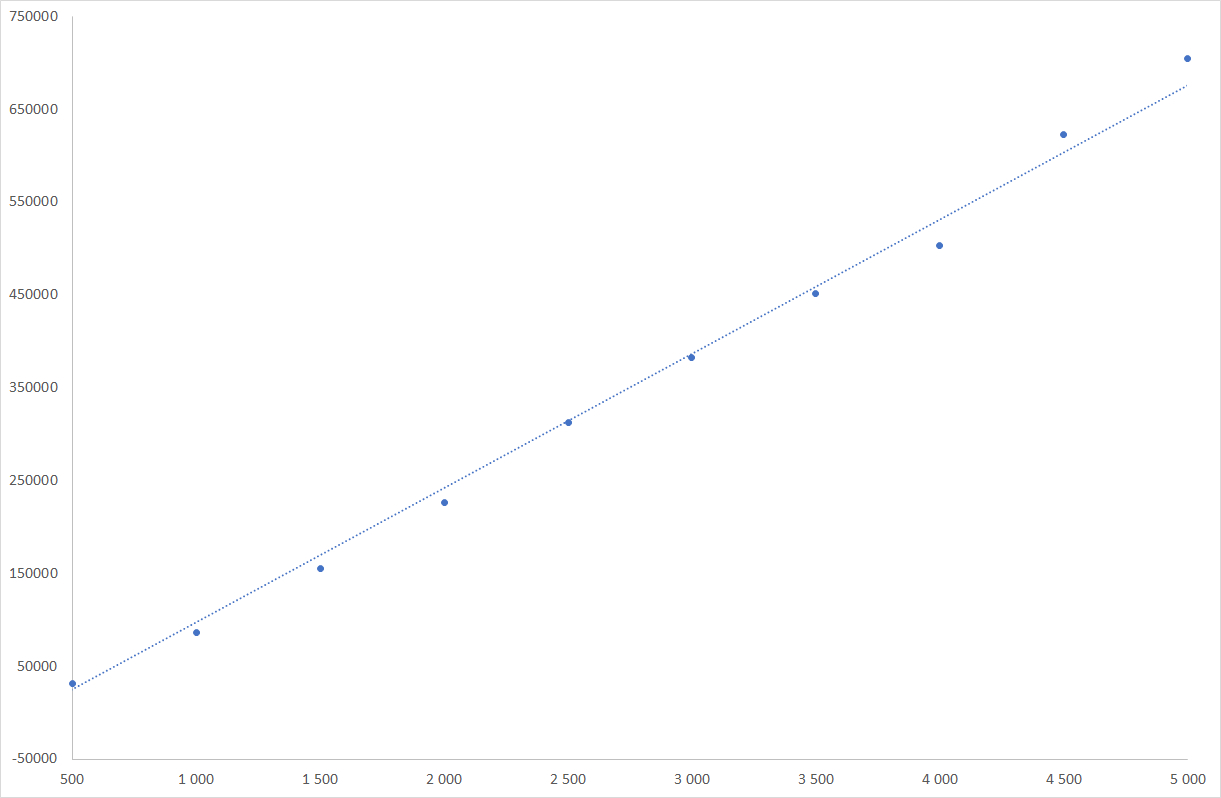
Sucrose linearity graph
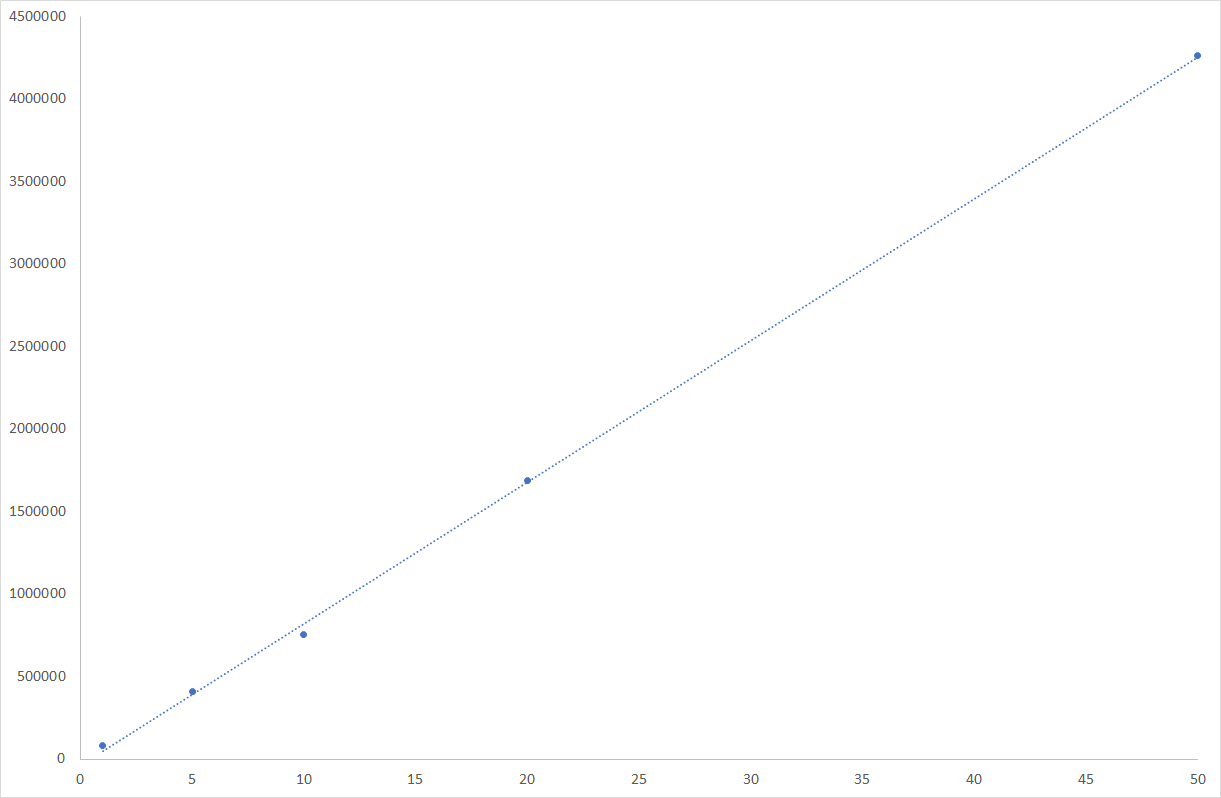
HMF quantitation data
HMF is detected at 284nm with UV detector. HMF response coefficient is high and allows its detection at low levels. Using both detectors and taking advantage of the wide dynamic range of the ELSD, we managed finding a sample concentration allowing both the detection/quantitation of HMF and carbohydrates. The honey is simply diluted with water at the concentration of 10mg/ml and injected without any pre-treatment for this study.
The quantities of HMF and carbohydrates are determined using an external calibration process. Linearity have been demonstrated using commercial standards of each component. Curves and results are shown here. Linearity is demonstrated for both UV and ELSD determinations.
Recovery on HMF is demonstrated on a honey batch in which a known amount of standard HMF is added.
| Regression Data | Fructose | Glucose | Sucrose | HMF |
|---|---|---|---|---|
| Slope | 115.78 | 122.20 | 144.64 | 857713 |
| Origin | -170157 | -220570 | -46669 | -36197 |
| Studied Concentration range | 1.000 to 50.000mg/L | 1.000 to 50.000mg/L | 1.000 to 5.000mg/L | 0.1 to 5 ml/L |
| Regression Coefficient | 0.999 | 0.999 | 0.993 | 0.999 |
| Sensitivity | NA | NA | NA | inf. to 10ppm in honey |
| Recovery Test | HMF quantity |
|---|---|
| Peak Area in natural honey batch | 5.3 ppm |
| Peak area in spiking solution | 31.4 ppm |
| Peak area in spiked honey solution | 37.4 ppm |
| Recovery | 98% |
This method has then been used for quantitation of several batches of honey collected from different sources and from several locations in Europe. Results are shown below:
| Fructose | Glucose | Sucrose / Maltose | HMF | |
| Honey batch #1 | 4042,26 | 3561,44 | 671,63 | 12 ppm |
| Honey batch #2 | 3779,94 | 3595,66 | 724,03 | < 10 ppm |
| Honey batch #3 | 4003,57 | 3592,66 | 628,37 | < 10 ppm |
| Honey batch #4 | 4500,03 | 3673,30 | 422,20 | < 10 ppm |
| Honey batch #5 | 4216,79 | 3605,68 | 614,96 | 10 ppm |
| Honey batch #6 | 3988,61 | 3619,94 | 718,38 | < 10 ppm |
| Honey batch #7 | 3960,67 | 3569,98 | 688,55 | < 10 ppm |
| Honey batch #8 | 4010,18 | 4135,31 | 538,29 | < 10 ppm |
| Honey batch #9 | 3963,63 | 3690,39 | 541,43 | 11 ppm |
| Honey batch #10 | 3987,02 | 4003,31 | 493,22 | < 10 ppm |
| Honey batch #11 | 3835,12 | 3830,22 | 575,78 | < 10 ppm |
Conclusion
A dual detection method is proposed for quality assessment of honey batches. This method uses both a UV detector for Hydroxymethylfurfural content determination, and a SEDEX LC ELSD detector with an important dynamic range to profile major carbohydrates in honeys. The use of those detectors allows a fast gradient analysis (15 min cycle time), without limitation and sample pretreatment.
This method is shown to allow easy major carbohydrates content, as well as HMF content, in the range of sensitivity required by Codex Alimentarius.
This method can then be applied as a counterfeit control method for honey of several origins, tracking for over the specification content of HMF (heating process and/or bad storage marker) as well as abnormal carbohydrate profile (scam attempt by syrup addition to the honey).
The method optimized allows the detection of major carbohydrates and HMF within 8 minutes
The carbohydrate content is high, and response of those compounds is in the ELSD linear domain, for which a simple linear relationship is possible
